Skip to main content
GIS Applications for Better Data and Smarter Spending

Geographic Information Systems (GIS)
From drones to 3D modeling and printing to virtual and augmented reality, GIS, and mobile technology, our industry has no shortage of incredible tools at our disposal—each one seemingly better than the last. At OHM Advisors, we’re using all of these technologies to solve problems on behalf of our clients, finding increasingly innovative ways to use tools like GIS to bring efficiencies to project management and execution across all areas of our business.
What is GIS?
In a nutshell, GIS helps make information manageable and more understandable. It’s rooted in the science of geography that provides a structure for gathering, managing and analyzing location data to make well-informed resource management, land use planning and a host of other project-based decisions. Often, it’s described as being similar to Google Maps—which is partially true, because GIS analyzes spatial location and organizes layers of location-specific data into maps and 3D visual images. But the tool goes well beyond mapping. It allows users to enter, manipulate, analyze and visualize data in an impressive amount of applications, revealing deeper insights such as data patterns and relationships.
The potential for GIS is limited only by the imagination about when to use it (and which tools to supplement it with). Whether you’re building a GIS system from the ground up, optimizing your current system or working on something in between, and whether you’re using it as a stand-alone tool or to complement other technologies such as drones and augmented reality, GIS offers a host of advantages that will save resources in the long run.
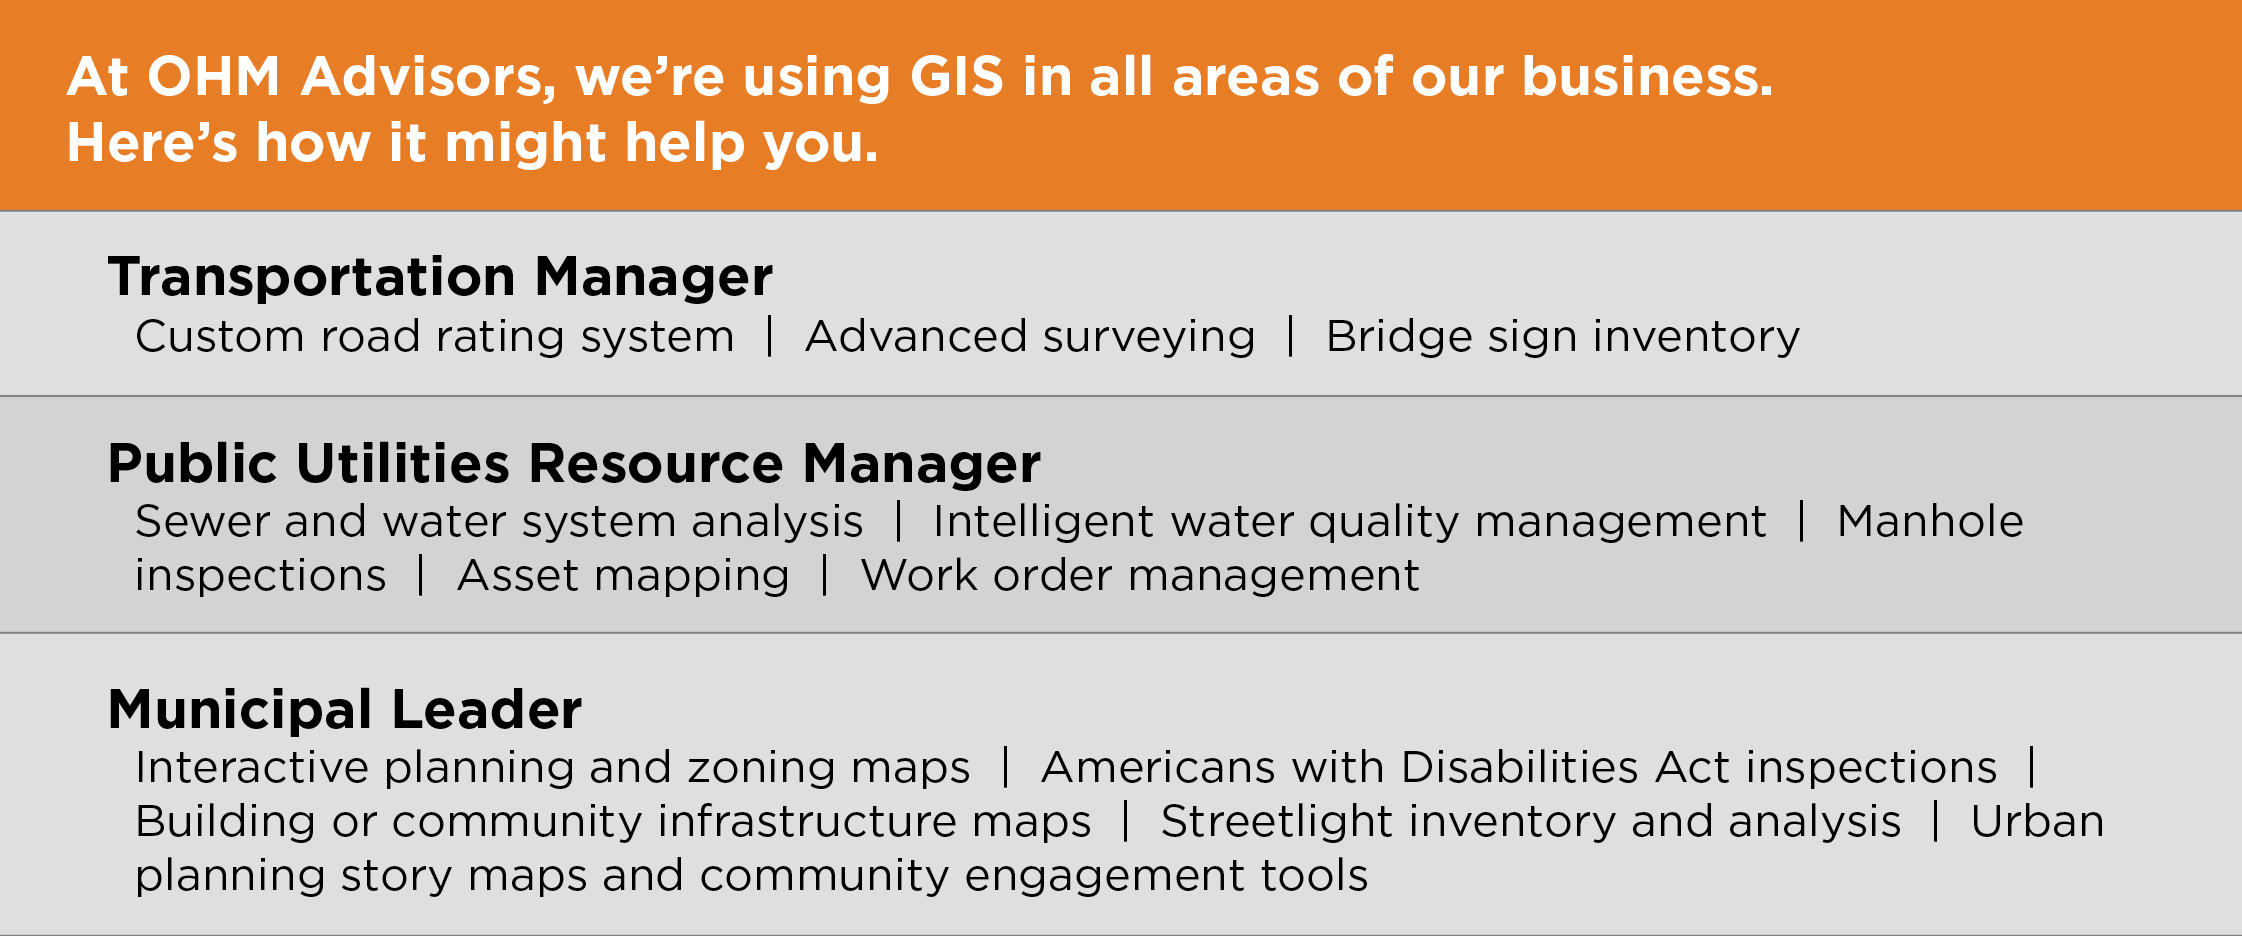
When it comes to using GIS applications, we’re striving to help clients across all areas of our business—from municipalities to private organizations—create better data systems that support faster decision making and smarter spending over both the short and long terms. Following are a few examples of how we’re doing it.

Improved data collection and analysis
Thanks to today’s technologies, gone are the days of field data collectors having to capture measurements, assessment data and images on paper and then haul it all back the office—sometimes multiple times over—and compile it into a manual, 700-page data bible.
Our field teams of surveyors, GIS analysts and engineers gather data using mobile technology such as smartphones, tablets, drones, GoPro cameras, IoT (Internet of Things) sensors and more, collecting all of the data using flexible applications like Esri’s “Collector” and “Survey 123.” GIS capabilities allow us to then overlay it with any online public data repository or database for a more complete picture or “story map” of the data factors in a geographical area. That entire data set forms the foundation for the built GIS application.
Interactive real-time database
Next, we publish that data set in real time via Esri’s ArcGIS Online, a cloud-based mapping and analysis software solution, where an operations dashboard enables users to use a variety of visual elements to see the real time status of people, services, assets, and events in the data set. Dashboard indicators alert users to problems in the area and provide essential information at a glance. Users in the field can access that online data via smartphones or tablets—saving time and allowing for fast, efficient decision-making.
And all of that data stays in the client’s GIS system for the long term, providing an enhanced catalogue of community assets in an easily reachable digital format that offers a reliable and lasting solution to asset monitoring. With these capabilities, we’ve helped clients complete projects in a fraction of the time required by traditional data collection and analysis methods, saving them significant amounts of time and money.
Case studies
Our GIS team recently completed an ADA assessment of a major airport terminal and a portion of its parking facilities to comply with a mandatory FAA update to be submitted every three years.
In the past, the client had used traditional methods to assess ADA compliance in those areas of the airport, working with paper-based data collection and cameras to compile a comprehensive, hard-copy binder report for submission to the FAA. Our team’s goal was to transform the process for better data and more savings now and for all future required assessments.
First came the data collection portion of the project. We took all of the existing data and imported it into ArcGIS online to create base maps of the area. This included reformatting multiple existing AutoCAD drawings of the area for upload and integrating them with new information. Then our on-site assessors collected spatial location data with respect to the floor plan using the Collector app as well as inspection information using Survey 123—a form-centric data collection tool that captures location information, collects photos and transforms paper-based data collection forms into digital forms that can analyze data and make calculations in the field.
Once we uploaded all of that information into ArcGIS online, the tool’s operations dashboard allowed our team to see all facets of the assessment area’s existing conditions in real time. We created a table of revised field data and provided it to our Architecture experts for analysis. They provided rehabilitation recommendations for areas needing updated compliance and associated cost projections, and we imported all of that information back into the GIS platform.
The deliverables to our client included a full ArcGIS geodatabase file—an active, dynamic file that can be updated by the client in real time and imported into their own online systems for use in remediating ADA compliance issues. The method saved untold amounts of time that had been spent in previous traditional data collection methods and compilation of the FAA report.
Our expert GIS team works collaboratively with other firm disciplines in multiple other projects as well—including on the completion of a multiple-county culvert assessment for a state DOT’s asset management system; an emergency response to a flood disaster that caused $7 million in damage to roads and bridges across nine counties; and a statewide inventory of all bridge connections and related signs throughout the entire trunk line system.
Unlimited potential
The potential for GIS to positively impact the AEC industry is boundless, limited only by our imaginations. While the tool itself is commonly used, it's the creativity and innovation behind how and when to apply GIS (and which tools to supplement it with) that has the potential to take your organization or municipality to the next level—whether you're a newbie or a pro.
To learn more about what GIS technology can do for you, contact our GIS team today.