Skip to main content
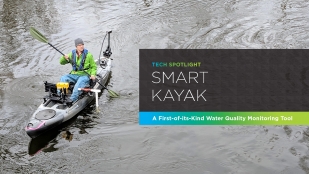
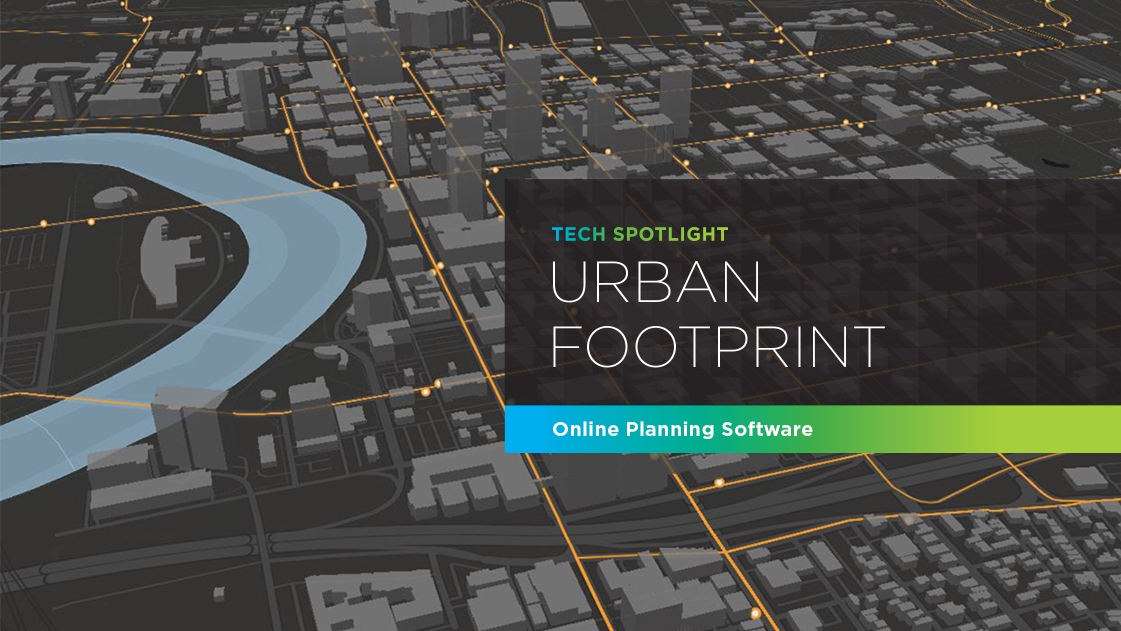
Urban Footprint: Online Planning Software
At OHM Advisors, our expert multidisciplinary architecture, engineering and planning teams are always exploring new technologies to help our public and private clients create the best possible solutions to their design and build challenges.
Last year, our firm’s Planning team was invited to partner with the urban planning professionals at Calthorpe Analytics to beta test its new product, Urban Footprint—the first-ever, end-to-end online urban planning software for sustainable planning and design. We jumped at the chance, and used the tool over the last year on several projects—including as the local planning consultant for the Mid-Ohio Regional Planning Commission’s (MORPC) insight2050 Corridor Concepts study, undertaken in conjunction with Calthorpe and a team of other consultants to prepare for the growth of more than a million people in Central Ohio in the coming decades.
What we found in the Urban Footprint software tool was something worth sharing, so we’re doing it here to launch a new series on the OHM Advisors website: the Tech Spotlight. Starting with Urban Footprint, we’ll highlight new technologies a few times a year that our team is using and collaborating with to help our clients advance their communities.
So, what is it?
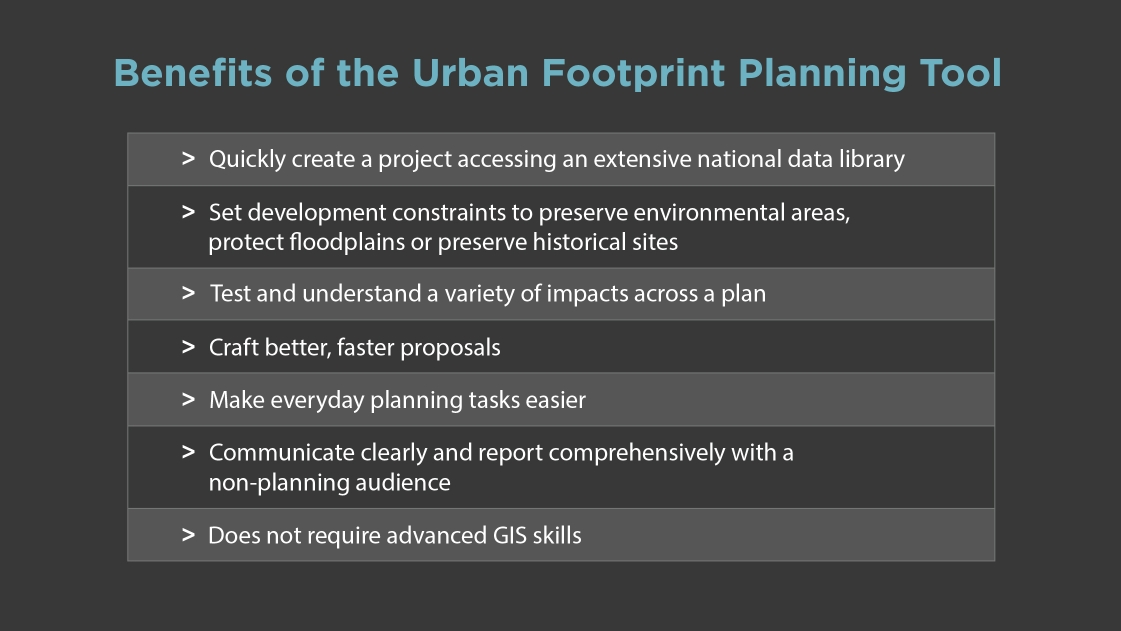
Urban Footprint is a cutting-edge land use planning and scenario-building tool created by planners, for planners. The online mapmaking and scenarios planning tool can be used to quickly gather data, create maps and analyze conditions for a proposal or project in a fraction of the time planners have traditionally spent on these tasks, resulting in faster results and cost savings for our clients.
Extensive Data Library
The tool has an extensive data library with pre-loaded land use, sociodemographic, transportation, and environmental data, among other types, across local and national sources. These data sets are updated periodically and contain identifying metadata so the user can pinpoint the information source. Users can also upload data from a different source—for instance, the county auditor’s office—to make an even more robust data set for the plan.
A user begins a project by creating a “base canvas” which is the starting point for the project and provides specificity for the area at the parcel or census block scale. From there, the user curates reference layers of data sets from environmental, infrastructure, roads, public health, sociodemographic and many other designations and adds them to the project to create planning scenarios in minutes. With an endless array of insight layers that a user can work into a community plan—i.e., How many housing units are within ½ mile of transit stops? How much water is being consumed in a one-mile radius?—the tool offers instant results and the utmost in planning flexibility.
Scenario Planning Workflows
A user has both basic and advanced tool options to take the base canvas plan and explore land use changes such as population increases and an influx of jobs to the area to plan future scenarios. Using “building”, “block” and “place” types, a user can create scenarios at any scale, from an extensive master plan to an analysis of a smaller, specific site.
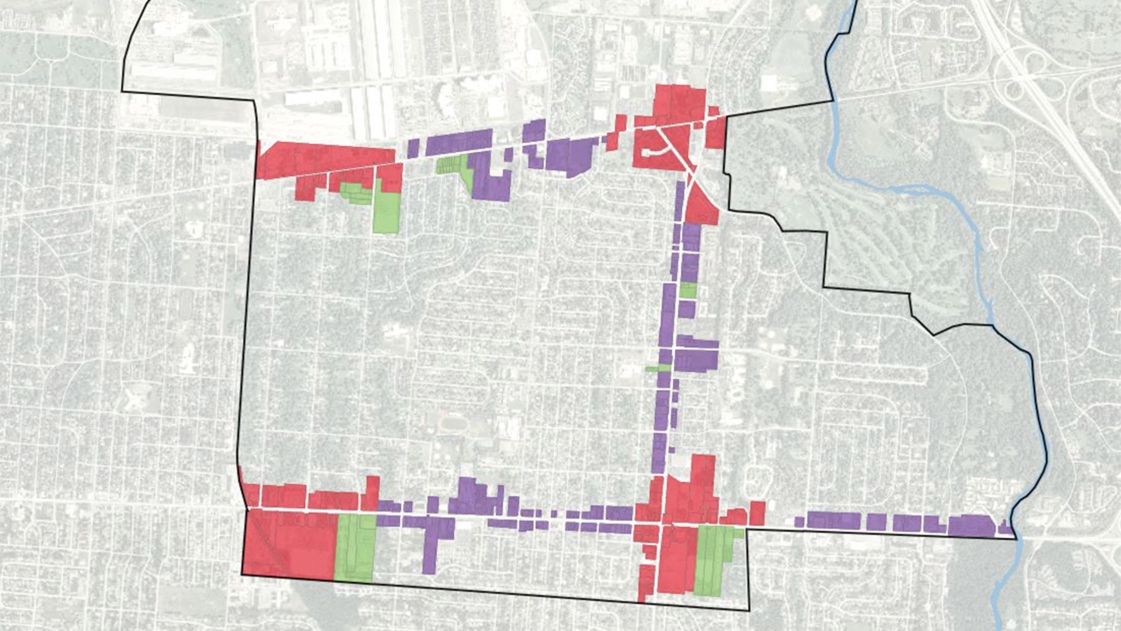
As part of the collaborative MORPC insight2050 study, Urban Footprint was used to analyze current and future land use and potential development scenarios in the study’s designated areas to determine each area’s ability to support high-capacity transit with increased population density. Individual cities concerned about the impact of insight2050 growth also benefited from Urban Footprint’s scenario planning function—our Planning team used it to help a small city client determine how to accommodate projected growth within existing boundaries. The client was considering densifying its main corridors, so we used Urban Footprint to create scenarios where both jobs and multifamily apartment units in that area increased significantly, and found that in order to accommodate population growth and put the city’s residents near public transit to those jobs, the city will have to focus on building residential housing upward.
In-App Analysis
The Urban Footprint tool also allows users to analyze land use, energy, transportation, water, public health, conservation, emissions and other key indicators to create comparisons between different scenarios and present alternatives to their planning clients. All maps, reports, exhibits and other created data can then be exported in those forms to other platforms and desktop GIS systems for further review and study.
What Urban Footprint is NOT:
The tool is not a GIS system, and planners don’t need advanced GIS skills to use it. Because there’s no GIS team gathering data and inputting it into the tool on a continuous basis, it doesn’t have the more in-depth capabilities of GIS.
The tool is meant to offer planners a time-saving way to create project scenarios and potential planning alternatives for a client that are easy to understand and a valuable tool to use with their public constituents. With it, cities can prove the economic viability of a project and its costs become more defensible to those they are elected to serve.
To learn more about this valuable planning tool from Calthorpe Analytics, check out their website at UrbanFootprint.com.